Also that headline is hyperbole. Welcome to my blog!
Let’s get one thing straight: the DH does not actually add “value” to any AL hitting lineup.
That’s also hyperbole, but not by much. Or rather, it depends on what that notion of value is compared against.
So let’s get started.
Baseball is an evolving sport, always. It might seem quirky but it’s only recently (starting in 2013) that the two leagues that comprise the Majors have each had 15 teams; so they’re numerically even now. Over the decades Major League Baseball has expanded with additional teams, who then got slotted into divisions, whose teams then bounced around divisions, and a few even traded leagues (illustrated in this 2010-era Yahoo! diagram, but most recently with the migration of the Houston Astros to the AL West (again so that each League would be 15 teams, consisting of three divisions of 5 teams each)).
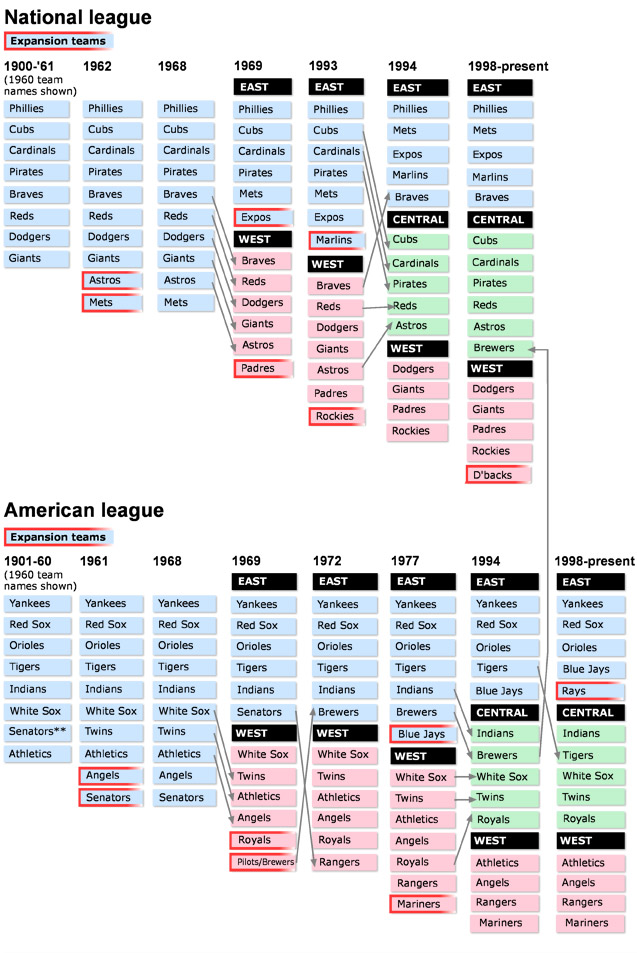
The long-story short there is capitalism now drives the great American pastime, with both big money and big data driving how team value is understood.
But it could be a whole lot simpler than that.
Again, for three years now each league has consisted of 15 teams in three divisions each consisting of five teams, what value does the DH really add to the AL?
Well if you win games by scoring Runs, what does the DH do for that statistic?
Here are the numbers*:
| American League | National League | difference | |
|---|---|---|---|
| 2013 RUNS scored | 10,028 | 9243 | 785 |
| 2014 RUNS scored | 9636 | 9109 | 527 |
| 2015 RUNS scored | 10,142 | 9508 | 634 |
*only caveat is these numbers assume all 15 teams in each league played all 162 games (i.e. no canceled games due to weather, etc.)
OK so one thing jumps out for sure: the American League consistently score more total Runs per season than the National League – I mean, WOW! … Right?Yeah OK so they do. Of course, that’s not to say those numbers are all attributable to the DH alone, and even if they were…
Well if they were, let’s break that down!
The 2013 season difference is 785 runs; divide that by 15 teams and that’s 52.33333 extra Runs per team; divide that by 162 games and that’s 0.32305 extra runs per game; or 1 every 3 games. Not astonishing. And that’s the best season on record thus far!
For 2014 the season difference was only 527; divide that by 15 teams and that’s 35.13333 extra Runs per team; divide that by 162 games and that’s 0.21687 extra runs per game – or let’s say 1 run for every 5 games.
The 2015 season is between the previous two: the season difference is 634; divide that by 15 teams and that’s 42.26667 extra Runs per team; divide that by 162 games and that’s 0.26091
extra runs per game, or just above 1 extra run for every 4 games.
And how much does that DH cost you in salary?
Or, conversely, how much more exciting is the National League not only because pitchers also hit, but because of elements like the double-switch that complicate lineups and keep pitchers and fielders and hitters alike on their toes a bit more because of the fluid, changing dynamics (not just bring in a new pitcher, now bring in another new pitcher). And perhaps those fluid dynamics are exactly what lead to fewer total Runs scored over the totality of a season, but I don’t care about that, and instead I want to see more-interesting baseball and managerial decision-making.
Do you see what I’m saying?
In the NL, switching out active field players during double-switches might very well be long-arc attributable to a diminished Runs scored statistic over the course of an entire season, but not by much: 1 every 3, 1 every 5, or 1 every 4 games. But in the end those switches – along with hitting pitchers and pitchers who see the game from that side of the plate – make for an overall more satisfactory appreciation of the game. And that’s good for players and fans alike.
Leave a Reply
You must be logged in to post a comment.